Prerequisite: before reading this tutorial, you need to know how to install, set up and use Highcharts in a VueJS project.
Using a stock chart when Highcharts is registered locally
If Highcharts is registered locally in the component you want to dislay a chart in, then you’ll have to import the necessary modules at the beginning of your component’s <script> part:
|
|
Using a stock chart when Highcharts is registered globally
If Highcharts is registered gloablly, then for the moment you main.js file should look like this:
|
|
To use HighStock, we’ll have to import the stockInit function, a Highcharts module. Afterwards, main.js should look like this:
|
|
Create a new stock chart
To tell Highcharts that we want to display a stock chart, we need to define the constructor-type when calling the chart component in the template:
|
|
Now let’s define chartOptions.
chartOptions will simply be an object defined in the data function of our component. For the sake of this example, we’ll just create a candlestick chart, but there are other possibilities.
|
|
Now of course we need some financial data. We’ll get the JSON data from a Highcharts demo at this address.
To make the HTTP request, just install axios in your project:
|
|
Then import axios in the component:
|
|
We’ll load the data in the created lifecycle hook, like this:
|
|
If you have a look at the data returned from the HTTP request, you’ll see it is in this order: [date, open, high, low, close].
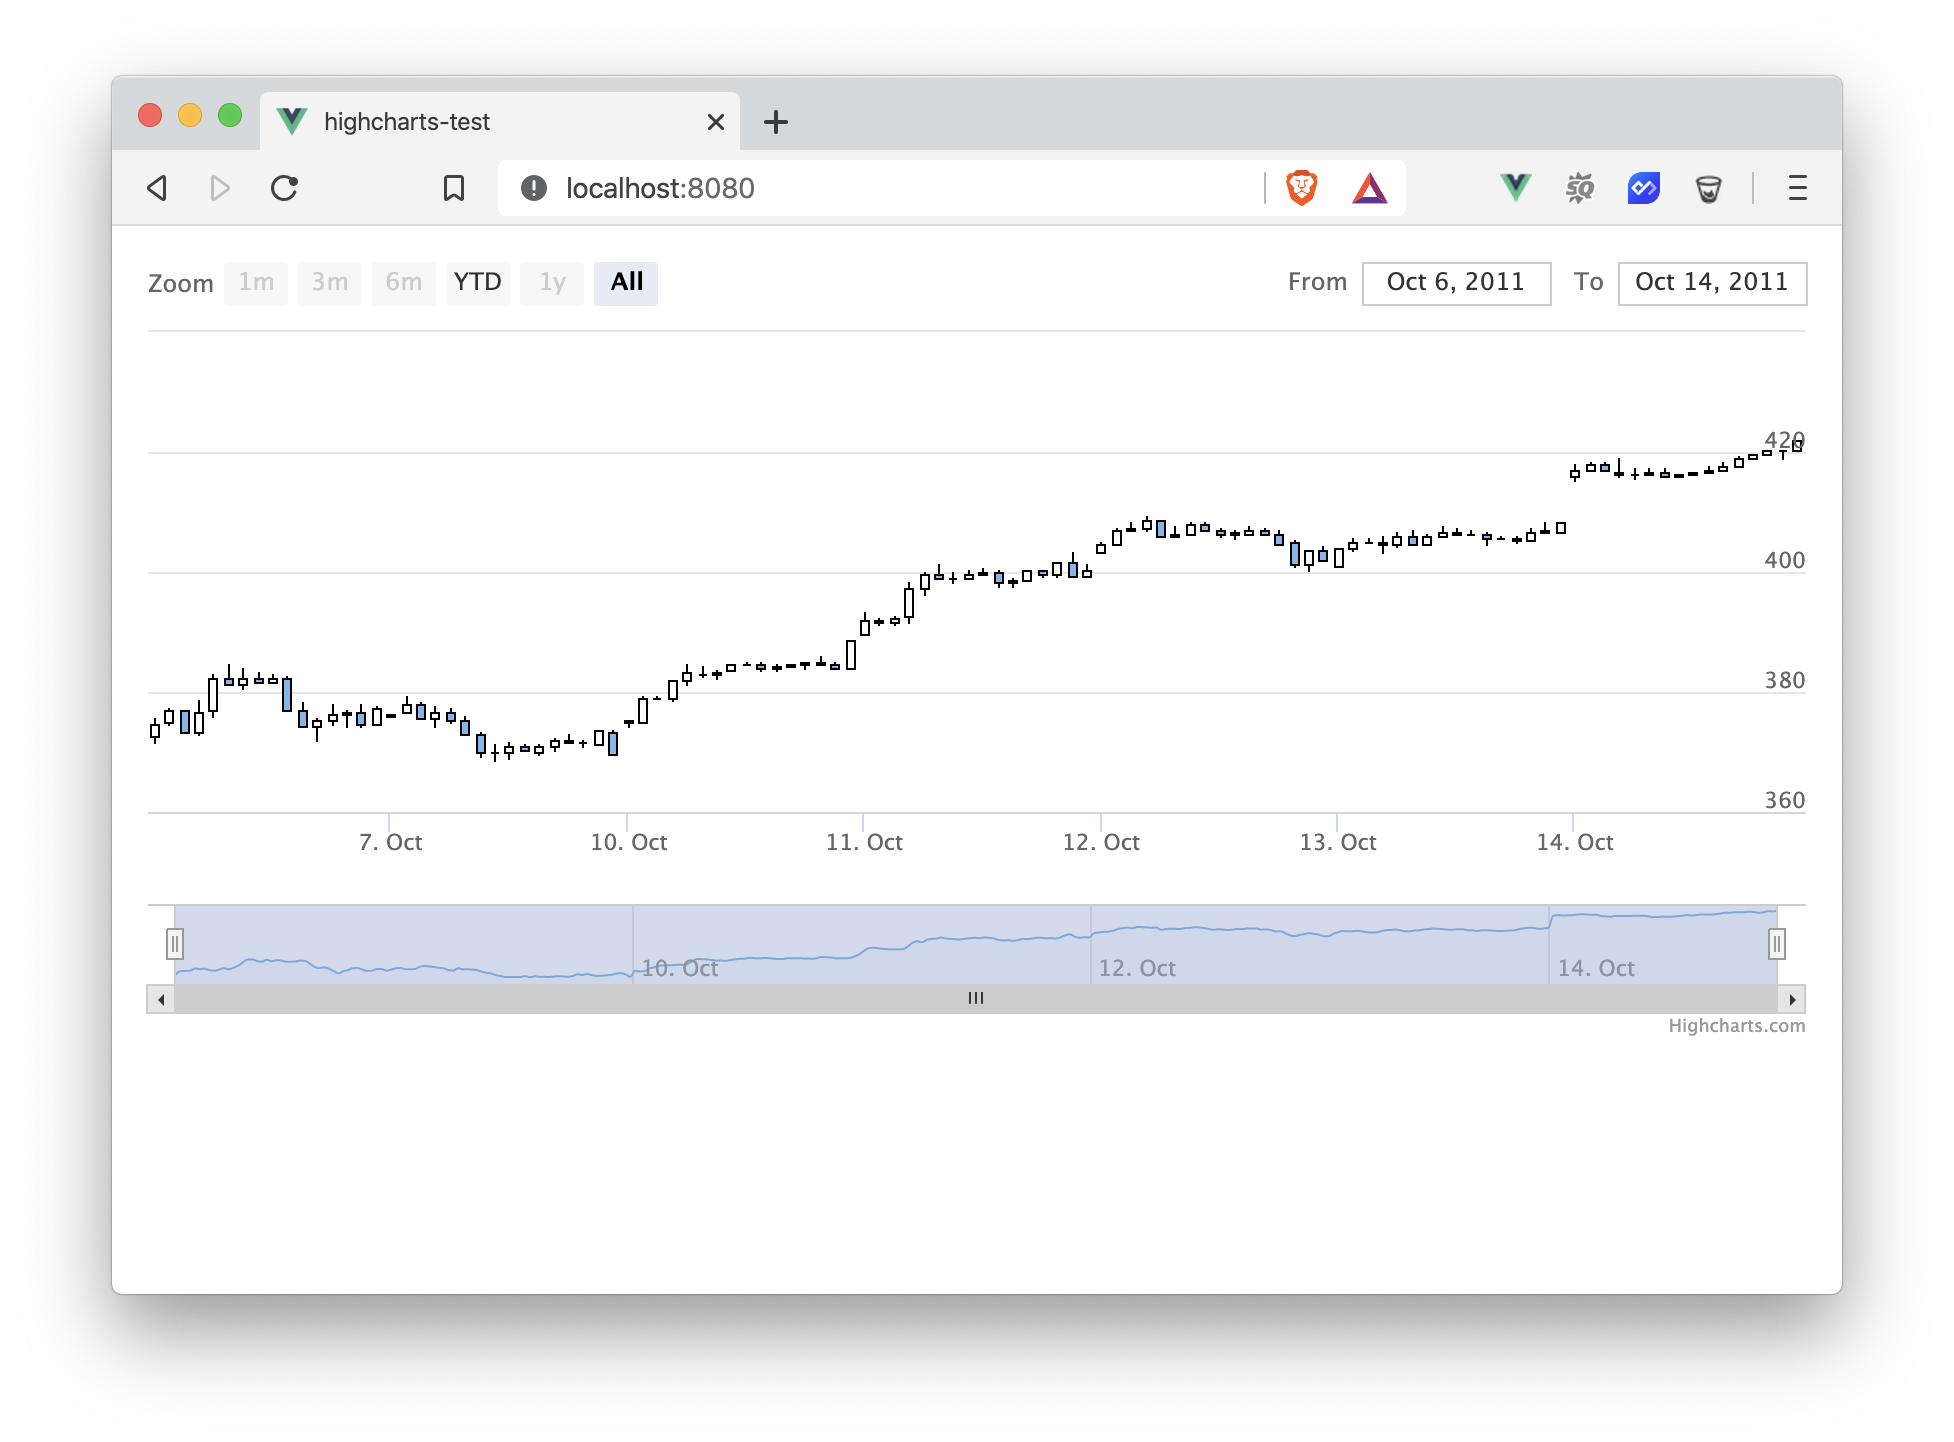
Now load your project in a web browser, and you should see something that looks like this: